![]()
Preliminary Findings From Mapping the Field
[Source: NAMAC, July 9, 2010]
 Mapping the Media Arts Field, our major survey of the media arts sector, officially closed on June 1. Partnering with the Alliance of Artists Communities, Alliance for Community Media (ACM), Independent Media Arts Preservation (IMAP), National Association of Telecommunications Officers and Advisors (NATOA), and National Federation of Community Broadcasters (NFCB), NAMAC distributed 1170 surveys electronically. We received 431 completed surveys, a completion rate of 37%. We received responses from organizations in 46 states, 7 Native Sovereign Nations, the District of Columbia and Puerto Rico.
The majority of respondents, 62%, operate as nonprofit organizations; 17% are government agencies; and 13% are programs within another organization. The remaining 8% of organizations include sponsored projects, incorporated, but not as a nonprofit, university/college programs and school districts. Though most organizations provide multiple services, when asked their primary organization description, 45% defined themselves as broadcasters/cablecasters (which also included webcasters); 10% described themselves as production facilities; 9% as media education; 6% as distributors; 6% multi-disciplinary; and 5% as membership organizations. The remaining 19% included visual arts organizations, university-based programs, preserves/archives, artists’ residencies and funders.
Primary media type created at respondents’ organizations included 36% television; 18% video; 12% radio; 9% film; 8% multi-media; and 5% web. Among the remaining 12%, media created at their organizations included new media, digital arts, visual arts, sound/audio and photography. Not surprisingly, 4% reported that there were multiple types or no primary type of media created at their organization.
Generation transition is occurring within this sector’s staffs. Gen-Xers make up 39% of staffs followed by Boomers at 34%; Millennials at 23%; Founders (over 65) at 3%; and Youth (under 18) at 1%. Staff characteristics included an almost equal gender split with 50% men; 46% women; 3% unknown; and 1% transgender. Race/Ethnicity of staffs showed 7% to be African American, 4% Asian American/Pacific Islander, 67% Caucasian, 7% Latino/Hispanic, 2% Native American, and 2% mixed race. The remaining 9% was unknown. 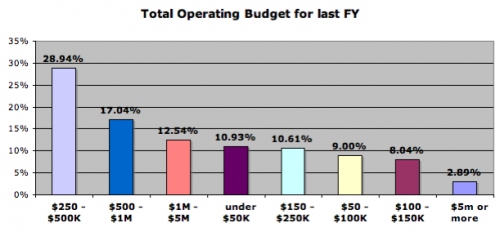
Annual operating budgets showed an almost even spread among categories; however the greatest percentage, 29%, have annual operating budgets between $250K and $500K. This was followed by 17% - $500K - $1MM; 13% - $1MM - $5MM; 11% under $50K; 10% - $150K - $250K; 9% - $50K - $100K; 8% - $100K - $150K; and 3% - $5MM or more. Government support is the largest revenue stream for these organizations registering at 37% of annual revenue. This is followed by earned income at 17%; business/industry support tied with foundation support at 10% each; private individuals 9%; franchise fees 7%, interest at 2%. The remaining 8% revenue sources include a mix of rentals, university-based programs, student fees and other nonprofits.
Over the coming months NAMAC will periodically report out on other finds from this data as we develop the full report on Mapping the Media Arts Field. Stay tuned!