![]()
The National Broadband Map’s Rural Fairy Tale
[Source: Special to Grantmakers in Film + Electronic Media, by Sarah Armour-Jones, May 31, 2011]
As a rural resident I know firsthand how unconnected rural areas are when it comes to high-speed Internet, and how much rural America is missing out on the economic, educational, healthcare, civic and cultural opportunities offered by broadband1. Given that I live the digital divide, I decided to see exactly what the National Broadband Map (“Map”)2 said I could get based on my home address.
My effort to unpack and explore the data presented on the Map aims to highlight – on a purely personal level – the extent to which this map is lacking, and how policy that is created based on the map’s determinations will not get us to the promised land of ubiquitous broadband access and connectivity.
Responses to the National Broadband Map have praised its scope and movement forward to assess the real broadband playing field for the country, as well as the opportunity to address incorrect information and help improve the accuracy and functionality of previous mapping efforts. However, critics point out that the information is much the same as previous efforts, based largely on self-reporting from telecom companies, enabling providers to claim broad, area-wide services when in reality they only serve a small slice of a listed area. Benjamin Lennett and Sascha Meinrath wrote a pointed criticism in a recent article for Slate:
“… users who search the map for broadband service providers at their home address may be surprised to find that they potentially have dozens of options. You get these bogus results for two reasons. First, the map relies heavily on self-reported data by the providers, who often paint their coverage areas with a broad brush. Second, it merges residential and business class services, so even if no residential options are available, your area may be considered covered. Together, these shortcomings give the impression of a market filled with lots of choices for consumers.” – Slate; May 18, 2011 3
Another point of concern is that the Map doesn’t require providers to share information on the cost of plans listed. Cost is a major factor in adoption rates, particularly when lack of competition produces little incentive to make broadband affordable. Of course, even when basic cost is listed, the actual cost can be much higher. Mandatory bundled services generally aren’t included in cost assessments for Internet access. For example, I’m forced to buy basic cable TV in order to get Internet through my cable provider. While my Internet cost is roughly $45 a month, I can’t get it without paying an additional $18.95 for basic cable TV – so my broadband connection really costs me nearly $64 a month.
The FCC acknowledges in its 2011 ”Broadband Deployment Report” (pursuant to Section 706 of the 1996 Telecommunications Act) that the U.S. is lagging in broadband deployment and adoption – particularly in rural areas. But according to the Map I have multiple high-speed options available.
Here’s what the Map says about my residential location: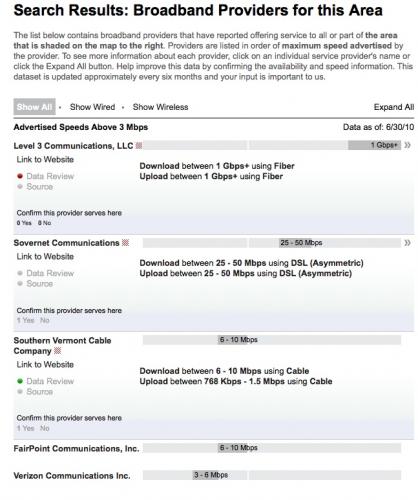
It’s important to note the language up at the top of the search results:
“The list below contains broadband providers that have reported offering service to all or part of the area that is shaded on the map to the right [emphasis mine]. Providers are listed in order of maximum speed advertised by the provider.”
Based on the Map, I should be able to get five providers offering everything from 3-6 Mbps to 1Gbps. Here’s the reality, based on exchanges with customer service representatives and/or pulled directly from the providers’ websites.
Level 3 – Fiber
Level 3 does not offer residential Internet. The Map shows this listing is under “data review,” which is promising because it acknowledges that Level 3 should not be considered a residential provider, but in the aggregate my address would show multiple providers that do not actually serve this house.
Actual broadband available: No
Sovernet – DSL
Basic DSL is 2 Mbps download, and for speeds above basic they may be able to provide 5 Mbps download/1 Mbps upload. That’s the highest speed I might be able to get. The Map claims I can get speeds of 25-50 Mbps from this provider, which is a significant error, especially for a DSL-based provider.
DSL-based technologies are distance sensitive and must be within 18,000 feet of the central office – and my house is located 17,900 feet from my town’s central office. When I spoke with a customer service representative I was told 17,900 feet actually won’t work. So while I technically qualify it won’t technically work.
Actual broadband available: No
Southern Vermont Cable – Cable
Southern Vermont Cable is my current broadband provider. They offer Standard Broadband advertised at 1.5 Mbps download/384 Kbps upload, and Poweruser Broadband at 4 Mbps download/768 Kbps upload.
Speed Test showed 1.07 Mbps download/0.51 Mbps upload; 0.31 Mbps download/0.13 Mbps upload; and 3.75 Mbps download/0.66 Mbps upload at different times and dates over a two week period.
Actual broadband available: Yes
FairPoint – DSL
The high-speed service is listed on the FairPoint website at up to 1.6 Mbps, despite the Broadband Map’s assertion that I should be getting 6-10 Mbps.
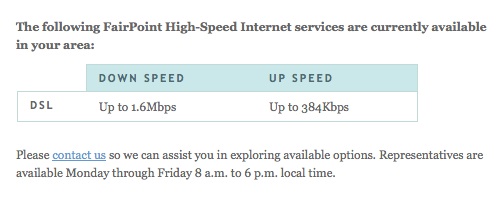
And on further digging it’s revealed that, “FairPoint High-Speed Internet is a distance-sensitive technology that works over copper phone lines. Currently, FairPoint High-Speed Internet is only available to customers residing within approximately 3 miles (up to 18,000 feet) from their FairPoint Central Office.”
http://www.fairpoint.com/northern_ne/residential/internet/highspeed/010_...
My house is not within 18,000 feet of a central office. In fact, here’s a map of coverage – both existing and planned. Note that dark green indicates a FairPoint service area. Notice how little dark green there is. 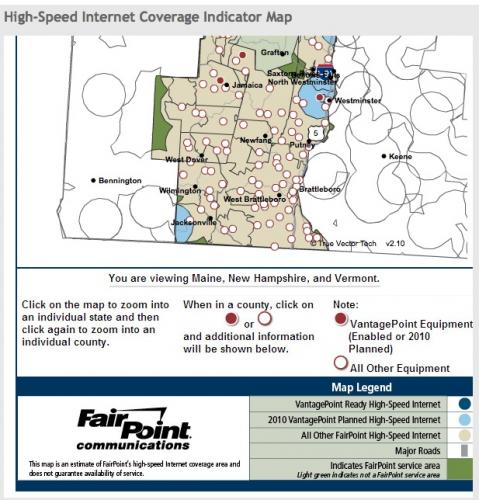
Actual broadband available: No
Verizon
The Broadband Map indicates that I can get 3-6 Mbps, but wired DSL high speed is not available at my house, and Verizon’s 3G mobile Internet does not offer fast enough speed based on the FCC’s own 2010 determination for broadband.*
Typical 3G mobile Internet speeds of 600 Kbps to 1.4 Mbps.
• Uploads – typical speeds of 500 to 800 Kbps.
• When in Mobile Broadband markets that do not yet have EV-DO Rev. A, customers can expect download speeds of 400 to 700 Kbps and upload speeds of 60 to 80 Kbps.
Actual broadband available: No
For those keeping score, out of the five broadband providers the National broadband Map lists for my specific address, three are not at all available, one is available at well-below listed speeds; and only one is definitely available and has, on occasion, met the speed listed on the Map.
It’s been an interesting and frustrating experience to see how disconnected the newly released Map is from reality, and how much data like these can distort policy and telecom planning and development efforts. It’s hard to make the case that a rural area is under-served, as my area truly is, when something as official as the National Broadband Map indicates otherwise.
We’re never going to truly connect this country if the focus of our collective broadband deployment work is to repeat erroneous claims about the number of options Americans have for broadband providers. The policies that support the current duopoly and monopoly business structure in broadband are crippling our rural communities but we won’t see forward movement on broadband competition (and therefore access, price and service) if we can’t even get the baseline data right.
[1] For an exceptional collection of articles on the digital divide see The Benton Foundation. For stories on life without broadband see our presentation on broadband and economic development and some terrific videos on the rural and urban digital divides created by Free Press.
[2] The National Broadband Map is a tool to search, analyze and map broadband availability across the United States. Created and maintained by the NTIA,in collaboration with the FCC, and in partnership with 50 states, five territories and the District of Columbia” – National Broadband Map http://www.broadbandmap.gov/
[3] http://www.slate.com/id/2294814/. For a response to this article from the FCC’s Steven Rosenberg see http://www.slate.com/id/2295855/ and a reply from the authors see: http://www.slate.com/id/2295880/.
* “The National Broadband Plan recommends as a national broadband availability target that every household in America have access to affordable broadband service offering actual download (i.e., to the customer) speeds of at least 4 Mbps and actual upload (i.e., from the customer) speeds of at least 1 Mbps.” – Federal Communications Commission Sixth Broadband Deployment Report, July 20, 2010