![]()
How a Web App Can Help Nonprofits Tell Better Stories and Raise Cash
[Source: Fast Company, by Jeremy Lehrer, July 2, 2012]
Tomorrow Partners introduces a free, open-source tool designed to help nonprofits tell their stories. Here, they share the guiding principles behind its creation.
Nonprofits depend on successful outreach campaigns to survive. They must consistently generate support for the work they do - and despite the advantages of Facebook, Twitter, email and other cause-oriented platforms in reaching out to receptive people, the web’s design and technology capabilities have expanded faster than advocacy groups have been able to use them. Sparkwise is a new data visualization and outreach platform that aims to help nonprofits, independent media organizations and individual activists communicate their initiatives and accomplishments with visual clarity, statistical tangibility and aesthetic verve.
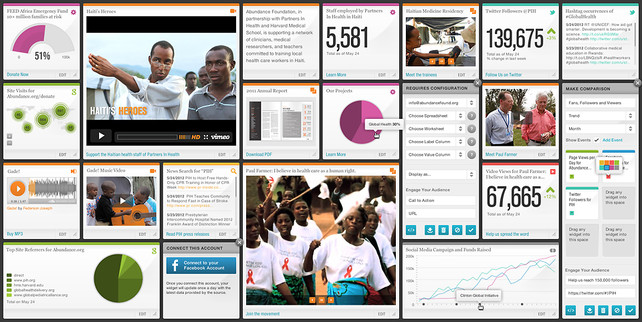
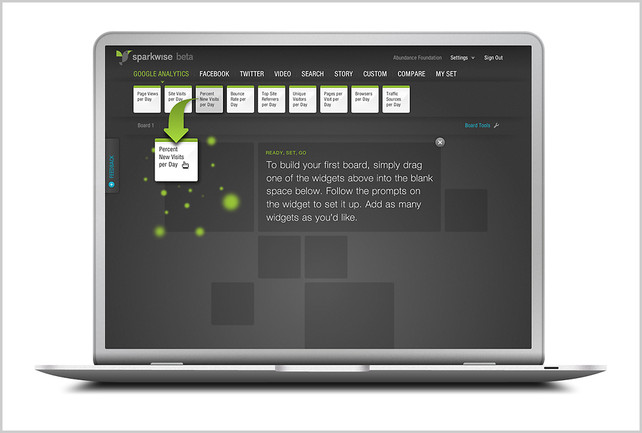
Conceived and designed by the San Francsico firm Tomorrow Partners to be the go-to platform for advocacy groups, Sparkwise is open source and free. It consists of a customizable, sharply designed interface that allows an organization - or individual - to present a rundown of essential statistics, information, news and stories relating to the organization’s mission, in the form of data visualizations, photos, videos, newsfeeds, tweets, etc. Each piece of data or multimedia element is featured in a widget, which can include everything from the amount of funds raised for a particular campaign to photo slide shows and graphs indicating, say, the rise in access to potable water. Design and the effective use of information are key to the presentation, with the data visualizations crafted to be elegant, colorful and clear. The dashboard is easily set up by choosing from a wide range of existing widgets, and organizations will be able to create new ones, with the data brought in from Google spreadsheets and JSON or XML feeds. The dashboard instantly shows the vital stats and stories.
Tomorrow Partners, founded and directed by Gaby Brink, designed the platform over the course of a year, first testing it with groups funded by the Bill & Melinda Gates Foundation, one of the project’s underwriters. Brink gave us the top 10 goals she and her team sought to address with the new platform.
1. Making Stories Easy to Tell
In contrast to the standard homepage, a Sparkwise page presents relevant stats front and center, juxtaposing them with the material that will help tell the story in a visually compelling manner. Using the variety of Sparkwise data and multimedia elements, organizations can convey their stories in a more engaging way and have a better chance of achieving their goals: garnering support for the organization, inspiring action and proving to individuals and funders that the work they’re doing is important and worthy of funding. This is all the more imperative at a time when budgets and wallets are tight.
2. Better Measurement Tools
In the process of developing Sparkwise, Brink and her team discovered that some nonprofits are relying on rudimentary spreadsheets to document their work and explain their impact, particularly when they submit that information to foundations that provide funding. There are several obvious disadvantages to this: A printed report quickly becomes outdated, and spreadsheets aren’t a visually engaging way to present information. In contrast, an online platform offers real-time results that can be continually updated; and the data visualizations make it much easier to grasp an organization’s impact and other related trends.
A customized dashboard can effectively be a kind of continuously updated annual (or even day-to-day) report. Brink adds that information about an organization’s efficacy is important to funding organizations like the Gates Foundation. “In the foundation world, there are very few tools or ways for them to track the impact generated by their investment,” she says. “The question that arose was, How can we measure this better and report on it more effectively?”
3. Data Should Always Be Visual
Data visualizations can be incredibly effective in expressing, capturing, and conveying information because they crystallize trends and impacts in a way that nothing else could. Tomorrow felt that by giving nonprofits a ready-made platform that makes it easy for them to create well-designed data visualizations, they could much more effectively showcase their vital stats and work. As Brink observes, “Stylized infographics are effective for making complex stories accessible and engaging.” The platform is versatile, allowing data to be shown in any number of ways - a pie chart, a trending graph, etc.
4. Make Transparency Easy
Transparency is a buzzword these days in both corporate and social-good contexts. Nonprofits need to show that they are having an impact and spending money effectively. Sparkwise allows organizations to reveal the behind-the-scenes numbers about what they are doing, but it also allows them to track information and data on “private” dashboards that they don’t reveal externally. The platform’s widgets remain hidden to outsiders until they are made public. Thus, an org can use Sparkwise for both external outreach and internal assessment. “The interesting thing about transparency is that there’s always an element of curation when you decide what numbers and metrics you want to share,” Brink says. “You rarely find radical transparency.”
5. Open It Up to Community Improvements
Tomorrow made Sparkwise open source, so it would benefit from the collective brainpower that will help innovate the platform. Scheduled to debut by the end of the year, the V2 version will include a software developers’ kit as well as a widget “bazaar” and a vetted collection of open data sets. If someone has a Eureka moment about a new widget or data set that would improve the platform’s efficacy, they can develop it themselves and add it to the offerings. Similarly, multiple orgs can team up and collectively fund a widget. Says Brink: “It’s cool to have a global community contribute to making something of value better.”
6. Humane Progress Tracking
Individual donors and funding organizations are often on the lookout for statistics and data showing an organization’s impact and on-the-ground achievements. But stats don’t tell the full story, and an obsession with numbers can prevent viewers from realizing the more subtle aspects of what an organization does. It might seem counterintuitive that a platform structured around a data-viz dashboard would also convey these subtler stories, but Brink says that the ability to juxtapose statistics with audio, video and other widgets allows organizations to convey the complexity of their work and the individual stories - as well as the challenges of activist work. “Data alone doesn’t move you,” Brink says. “Data in a rich context does.”
7. Easy for Novices and Experts
Tomorrow wanted to make a platform that was intuitive and suitable for people with a range of data expertise. The platform uses a drag-and-drop interface, and the featured data can be drawn from spreadsheets as well as XML and JSON sources, allowing both novices and more advanced users to use the platform. While not able to discuss the details, Brink promises that the V2 release will “be unlike any existing data platform.”
8. A Key Feedback Point: Self-Analysis
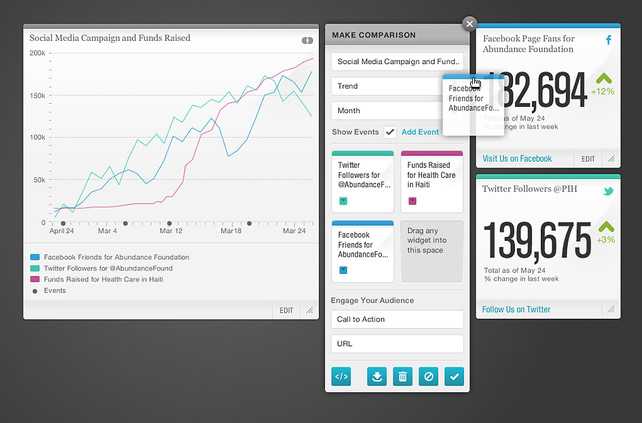
Any therapist worth their salt will tell you the benefits of a little self-analysis. The beauty of the Sparkwise visualizations and widgets is that they allow organizations to look for trends and to find correspondences between the different sets of information that they track. By overlaying a history of Twitter feeds with a chart showing data about donations and memberships, nonprofits can assess what strategies were effective and then aim to repeat them again - and avoid the tacks that weren’t successful. They can also suss out other trends and correlations relating to news events or the data held by other organizations.
9. Building In a Sense of Shared Effort
Another aspect of the self-analysis involves developing a methodology of “best practices” that different organizations can share. Sparkwise intends to publish case studies and “toolkits” relevant to certain areas - i.e., advocacy, independent journalism - so that the Sparkwise system can be refined and groups in similar areas can share what they discover. An organization that tests out a particular widget or data set can assess how effective it was in providing a picture of its work or in generating interest from potential supporters; groups focusing on a similar area of advocacy can also set up shared dashboards that allow them to share information and data sets relating to their work.
Brink hopes that Sparkwise will be a great leap forward in helping organizations more effectively achieve their goals - while also giving funders an efficient means of assessing the groups they want to underwrite. But she also sees the platform being used not only for social good but by for-profit businesses looking to track sales, engage audiences and monitor workflows: “Our long-term vision is for Sparkwise to be an innovation hub for new, more effective tools in measurement, evaluation and audience engagement for impact-driven organizations in any industry or issue area.”